Air Temperatures

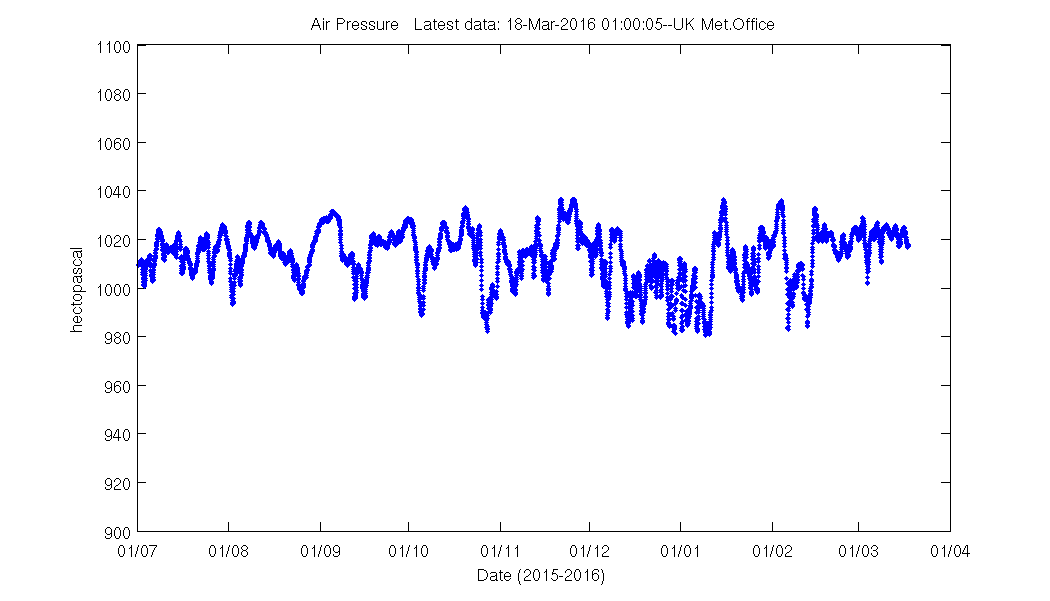
Air Pressure
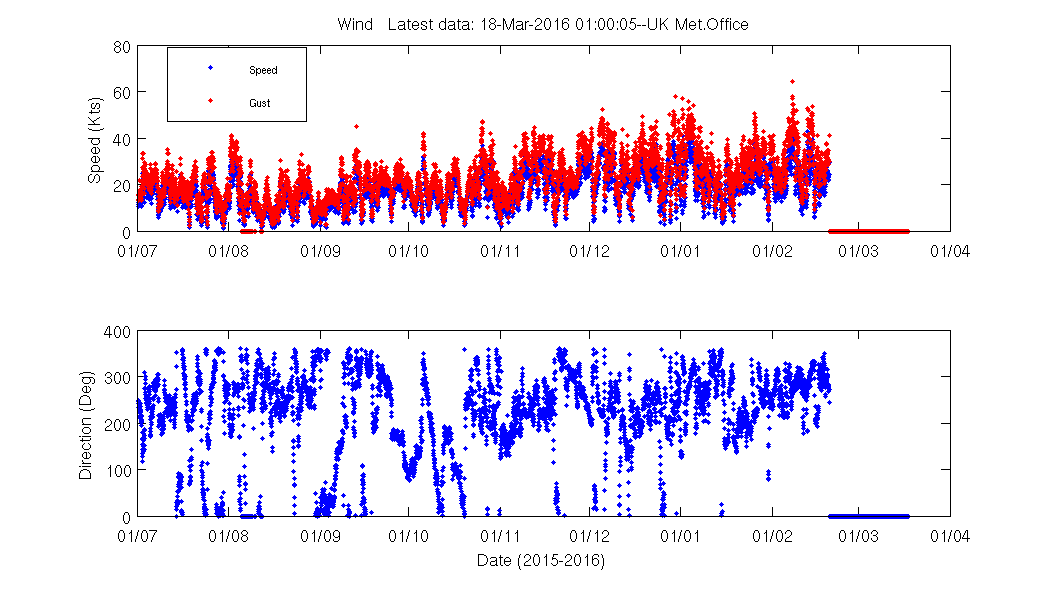
Wind
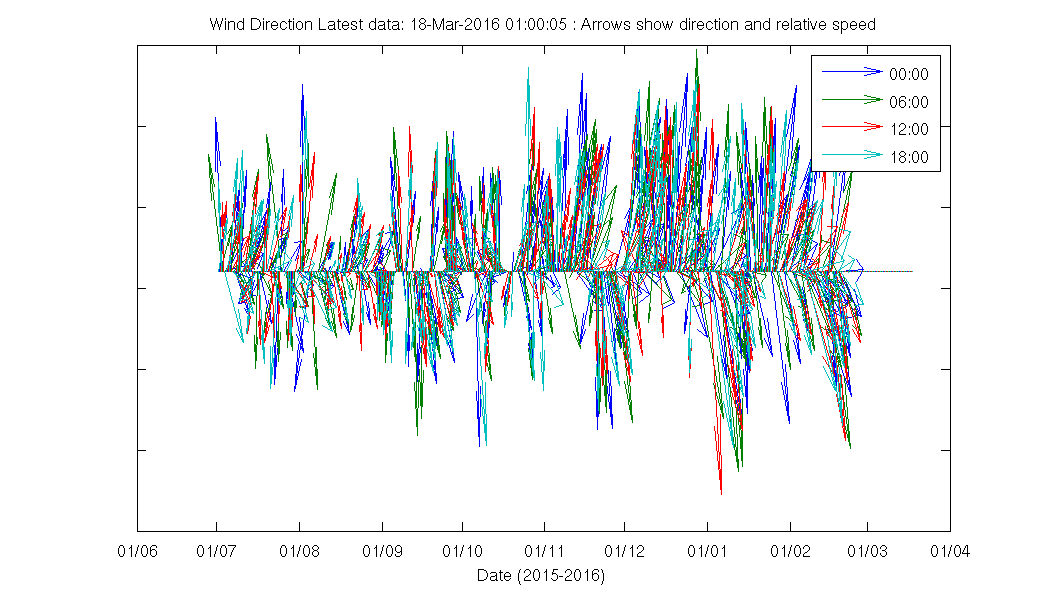
Wind
Wave Direction
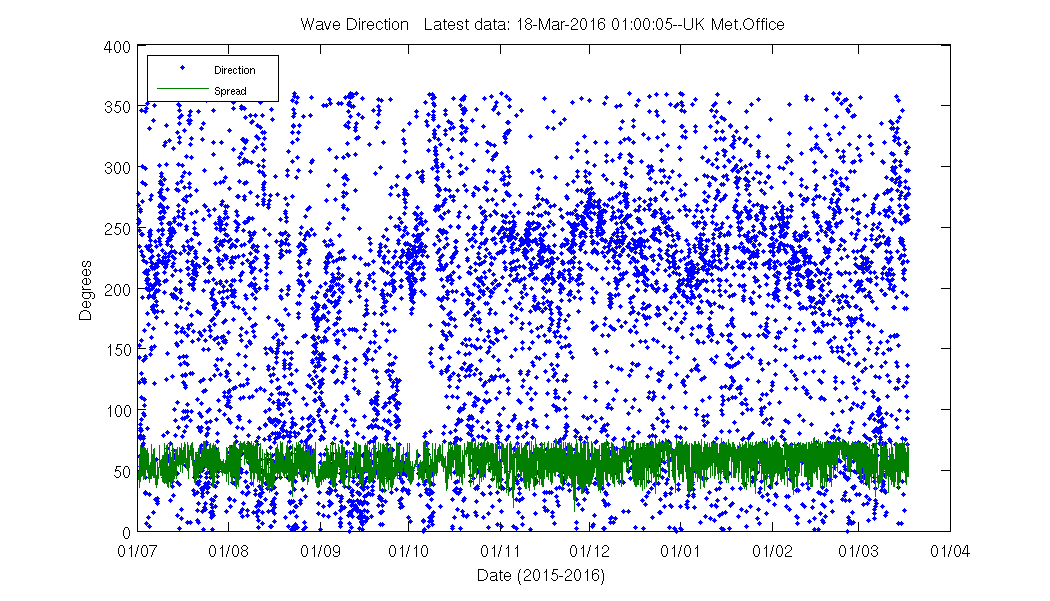
Wave Direction
Wave Height

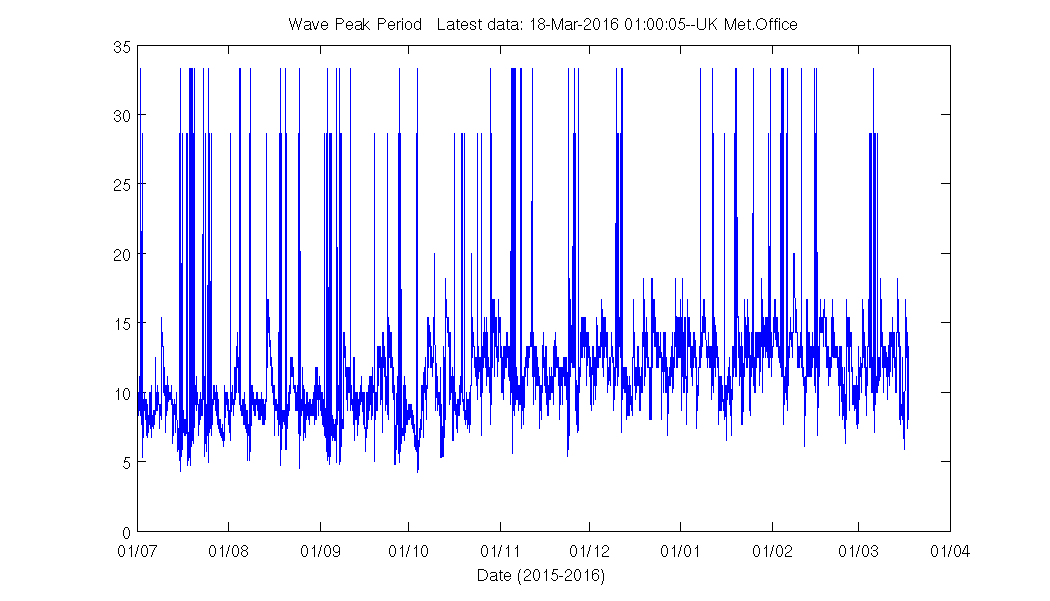
Wave Period
Pro Oceanus pCO2 differences

Pro Oceanus all readings
Pro Oceanus pCO2 differences

Pro Oceanus RAW

Pro Oceanus AZPC

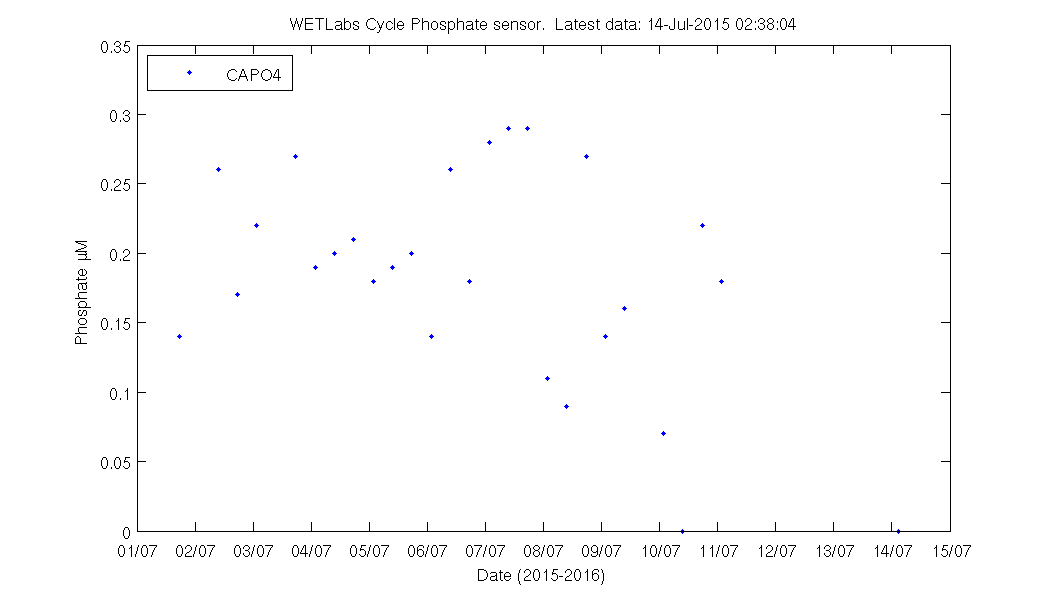
Phosphate : WETLabs
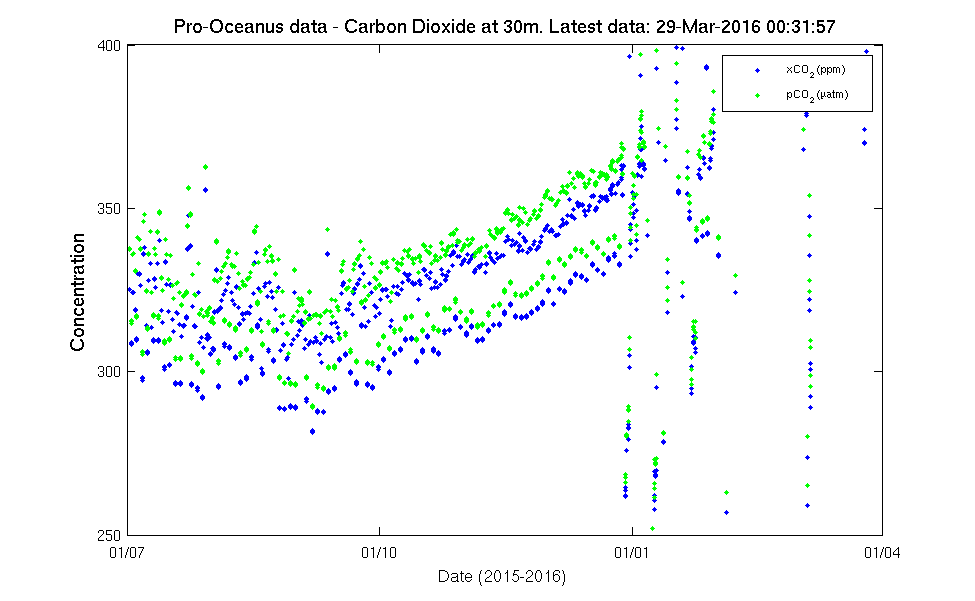
Carbon Dioxide: Pro-Oceanus

Pressures

Aanderaa: CO2
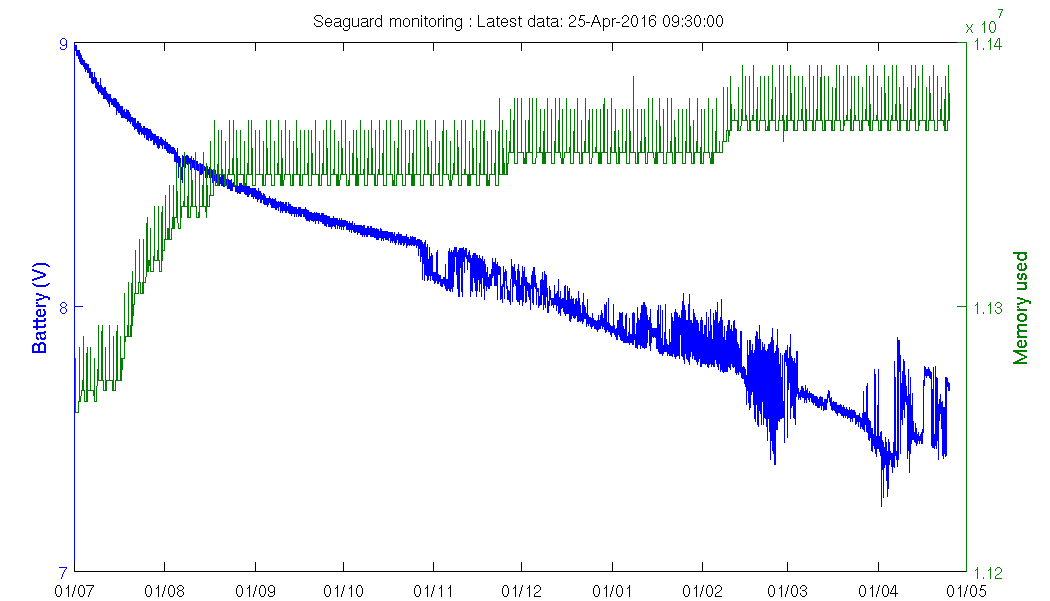
Seaguard monitor
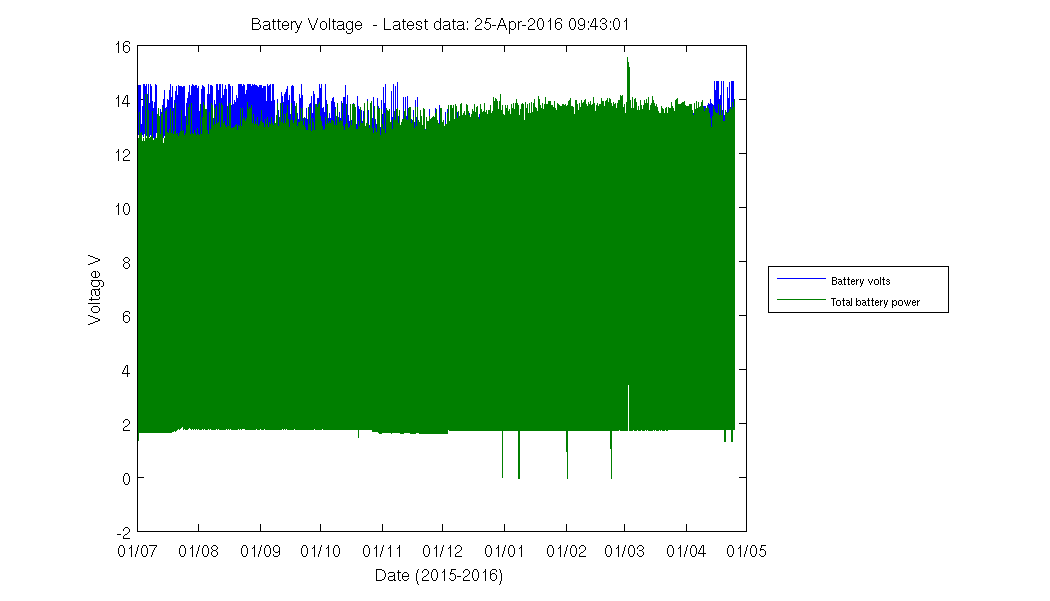
Voltages
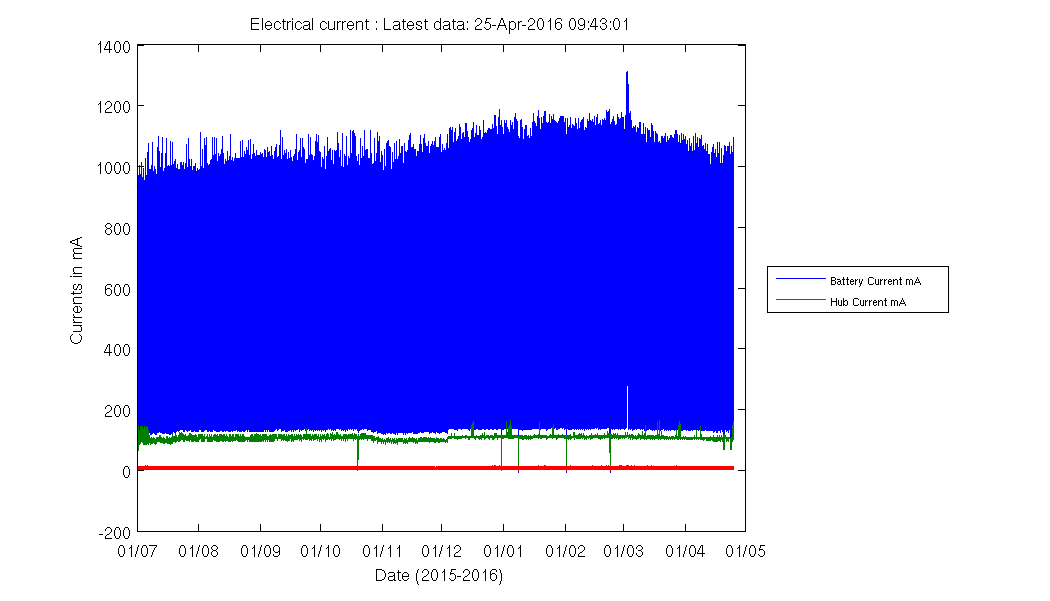
PWR Current
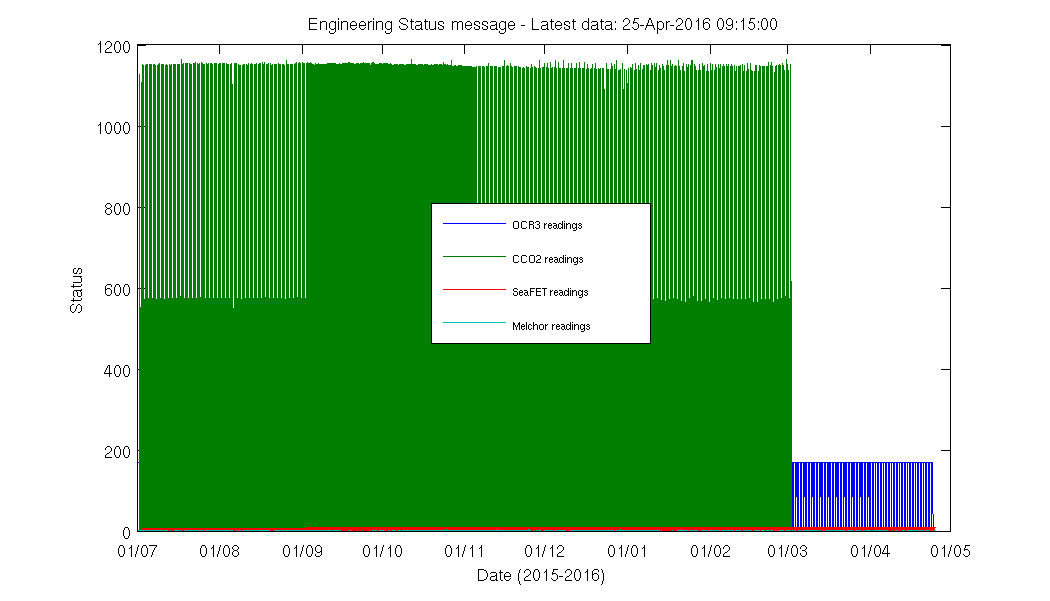
Monitoring ST1
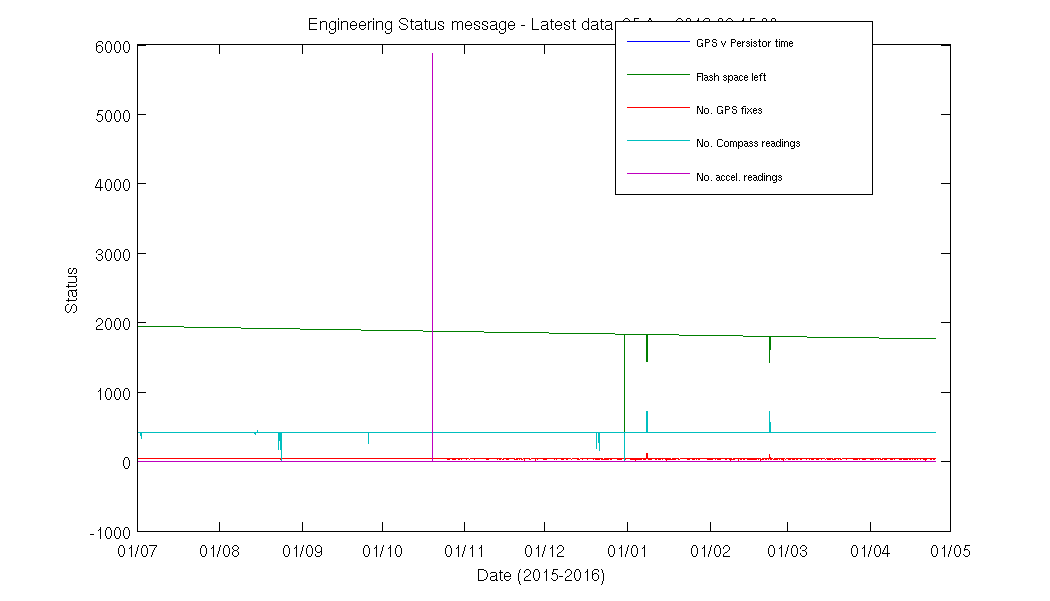
Monitoring ST1
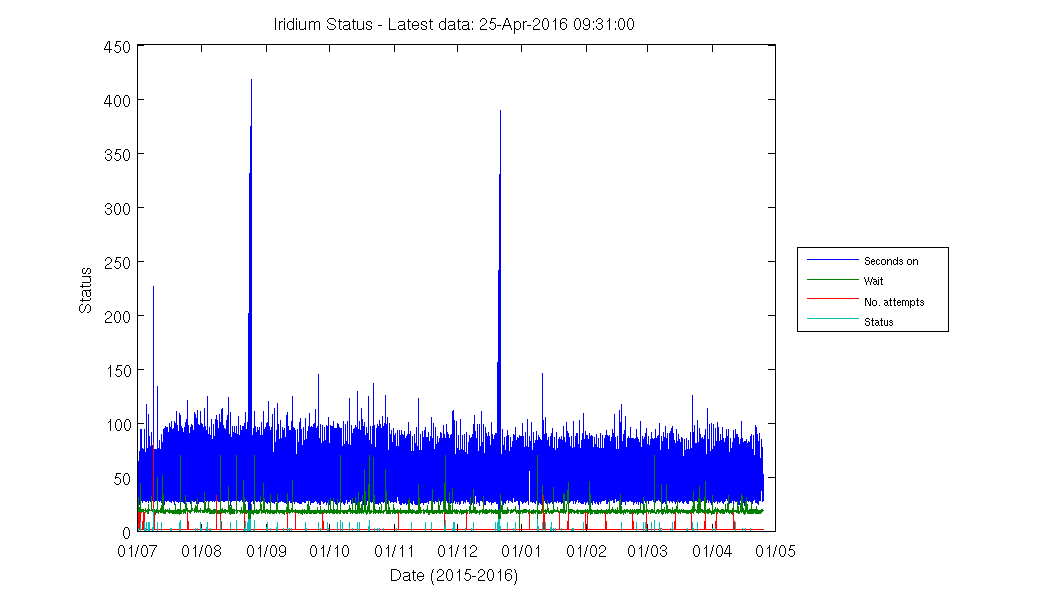
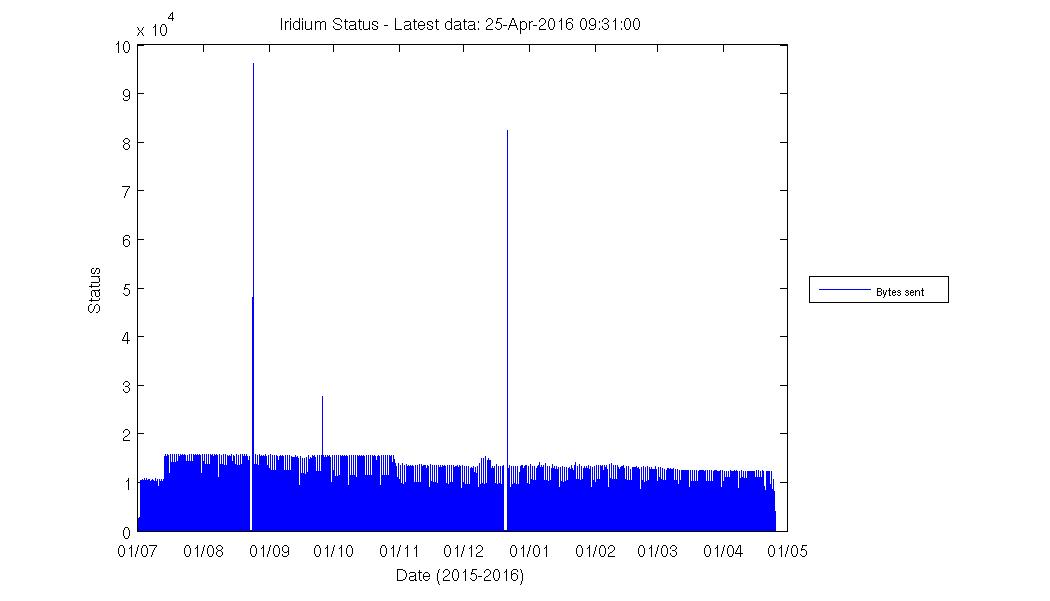
Iridium Monitors
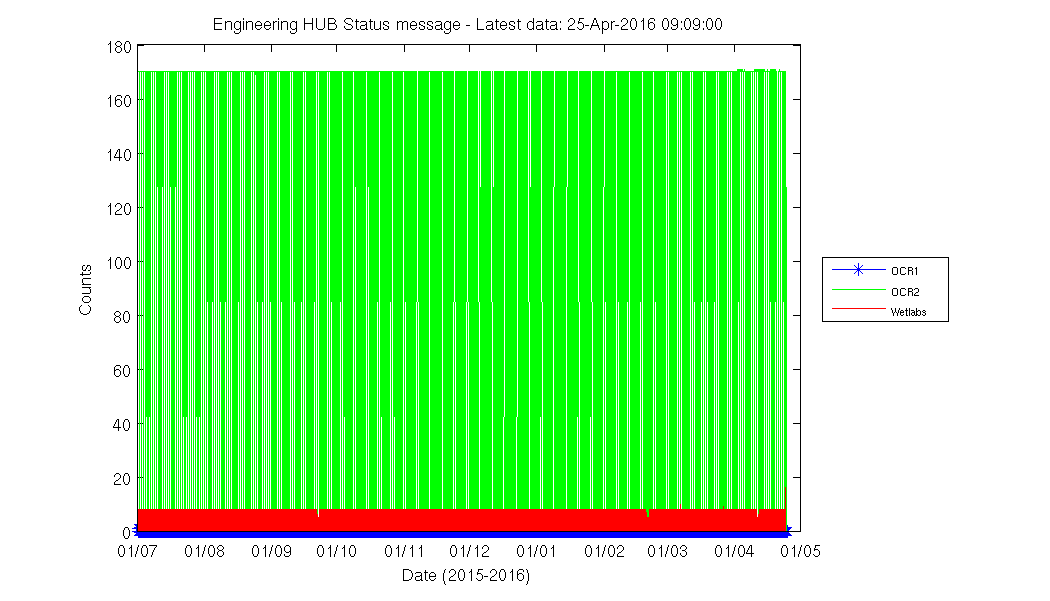
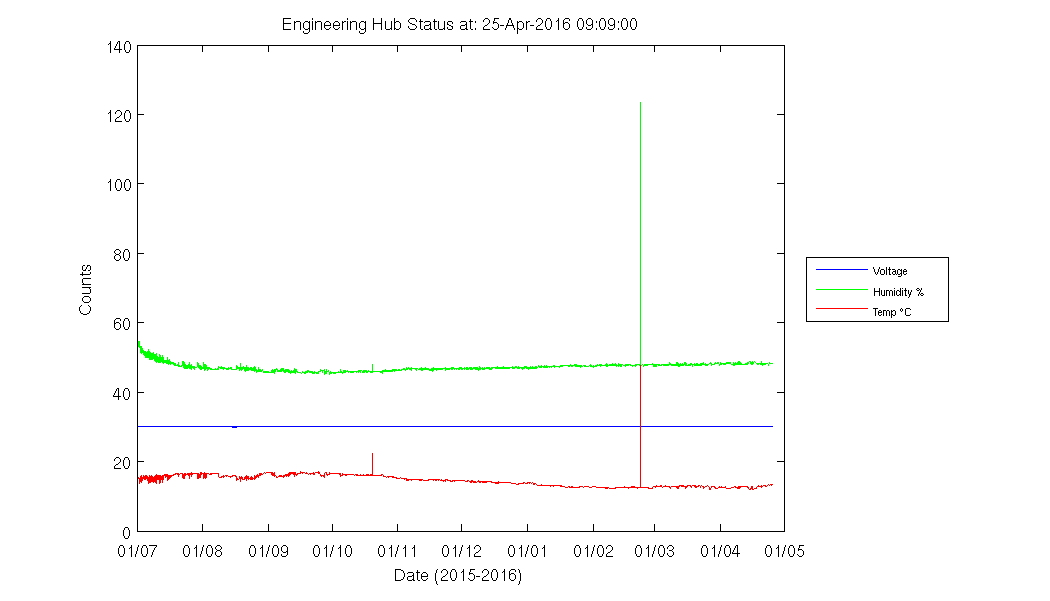
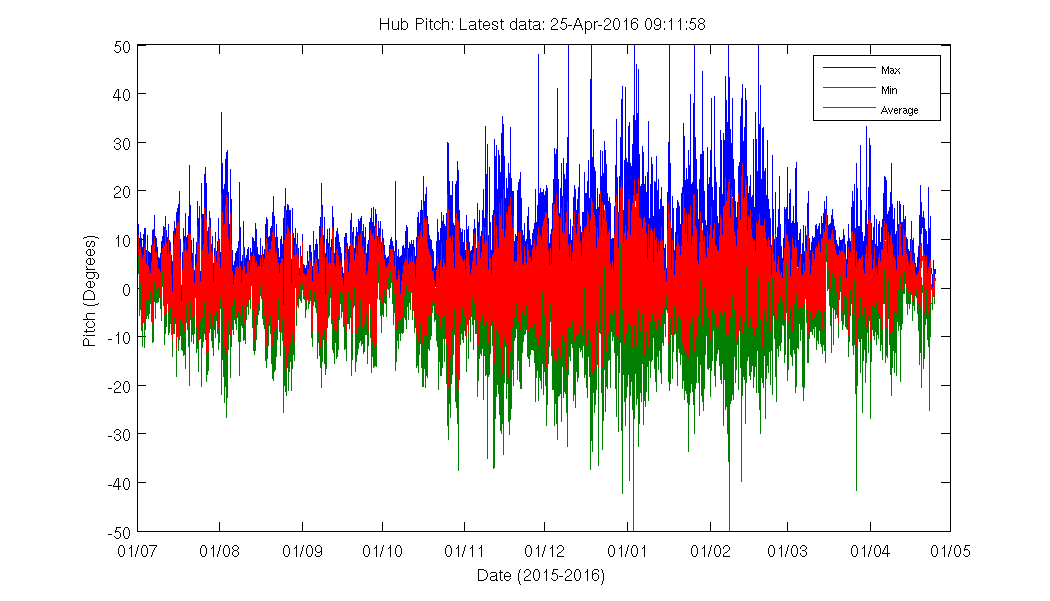
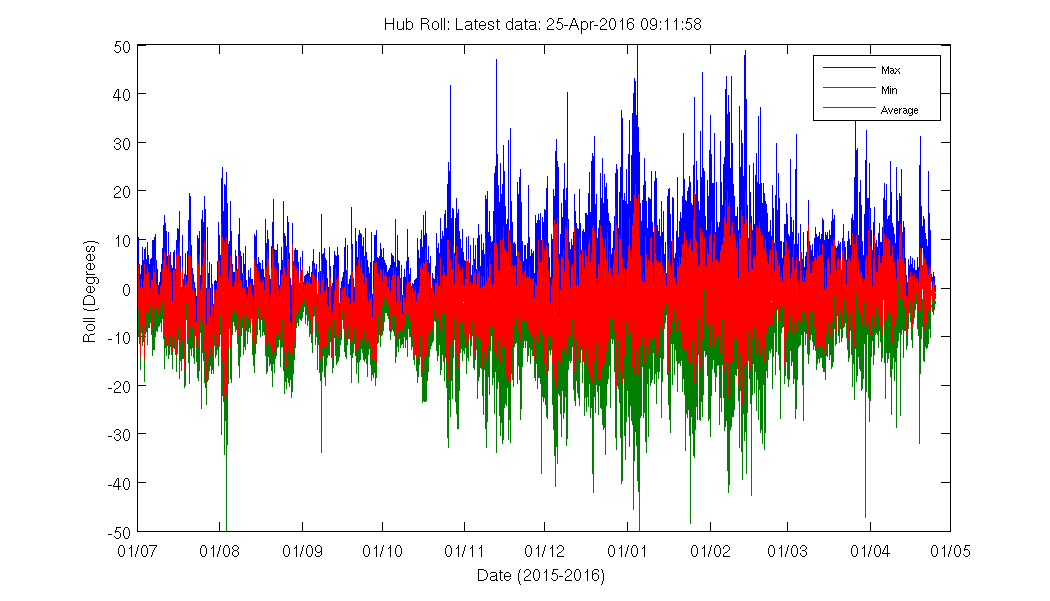
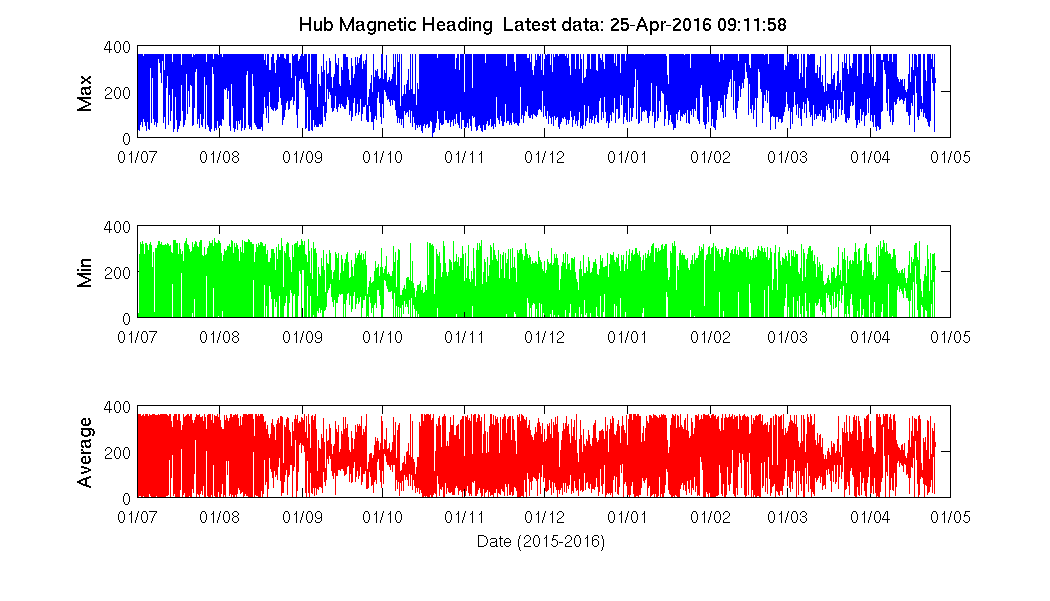
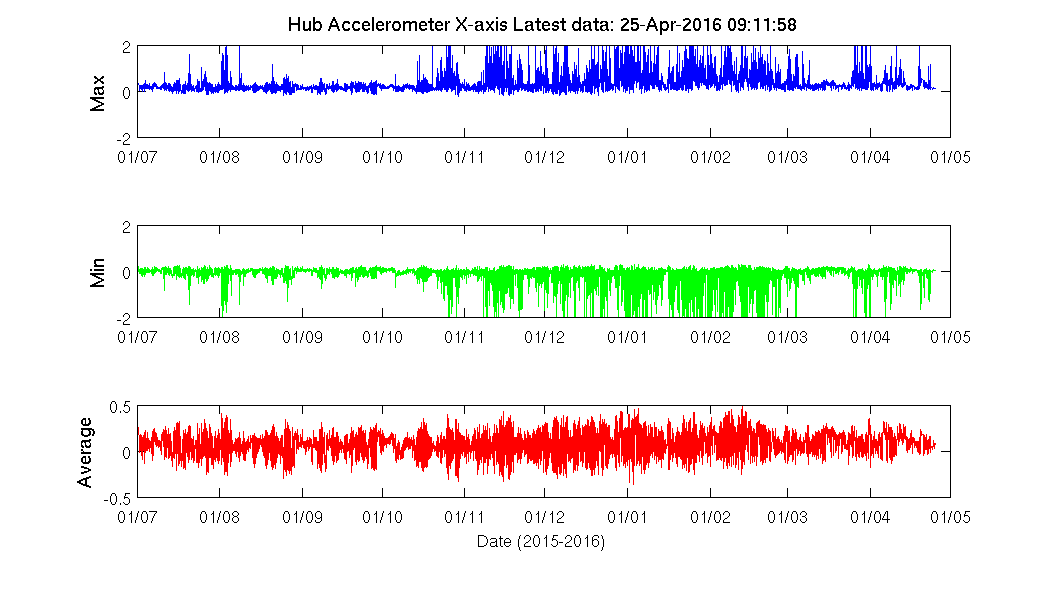
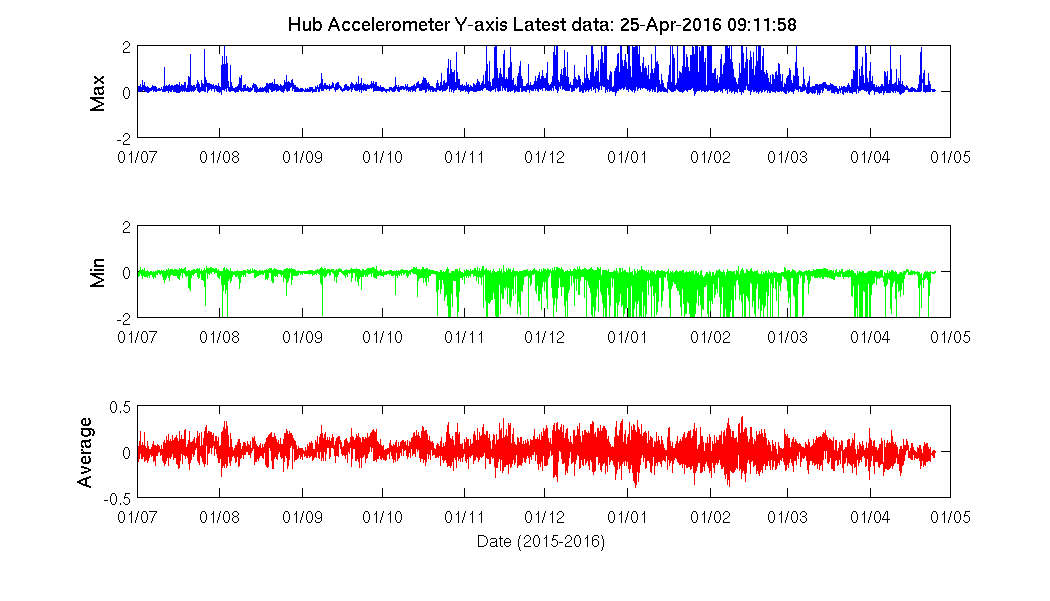
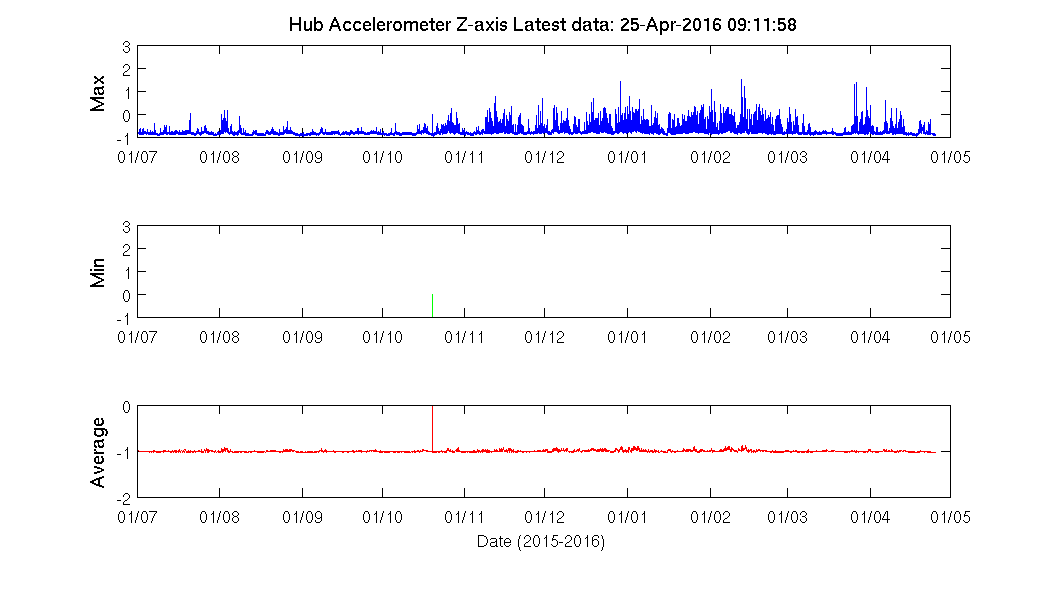
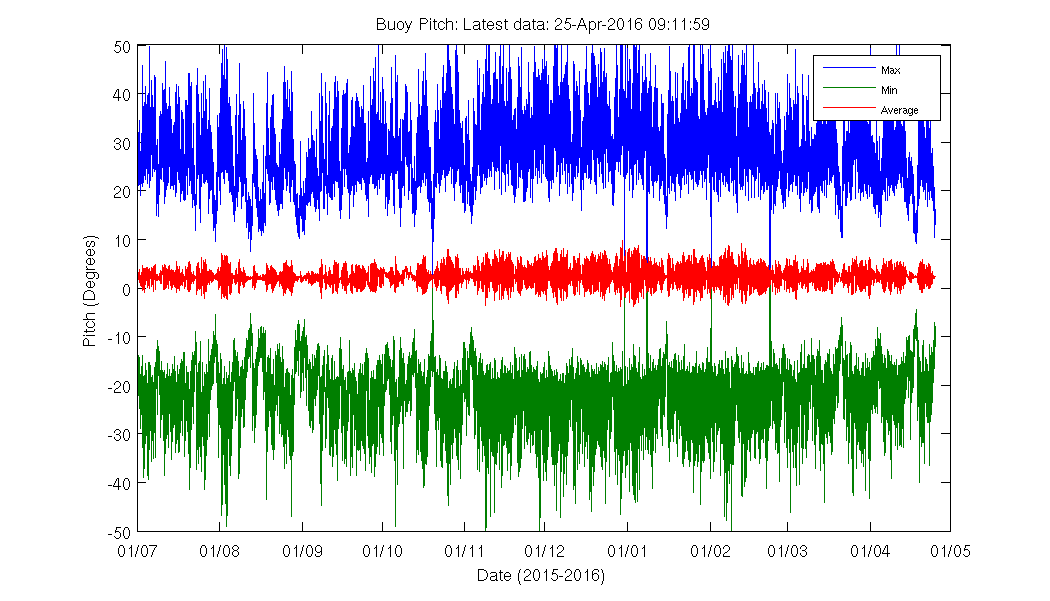
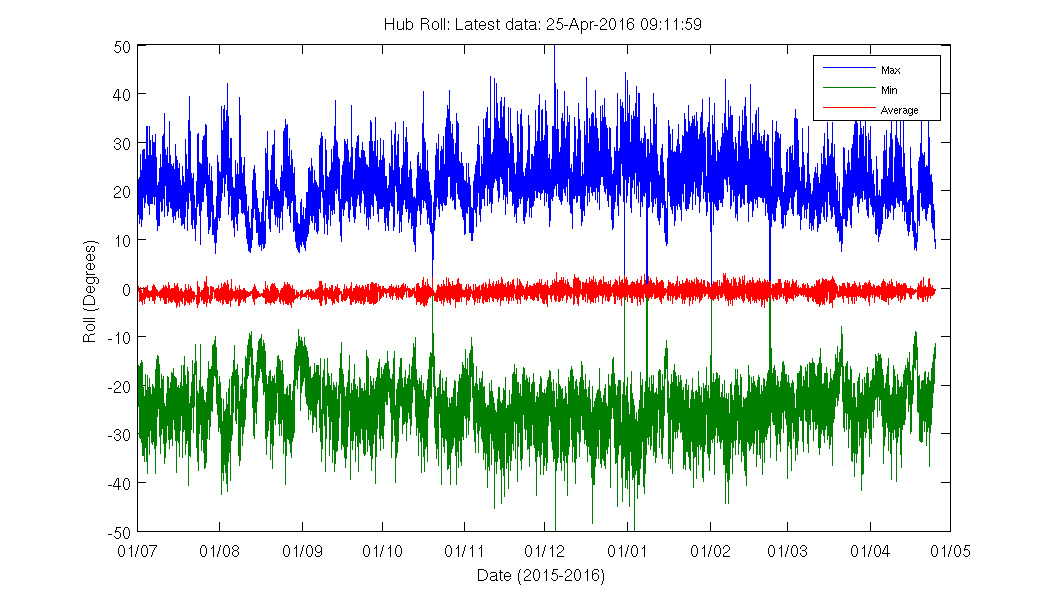
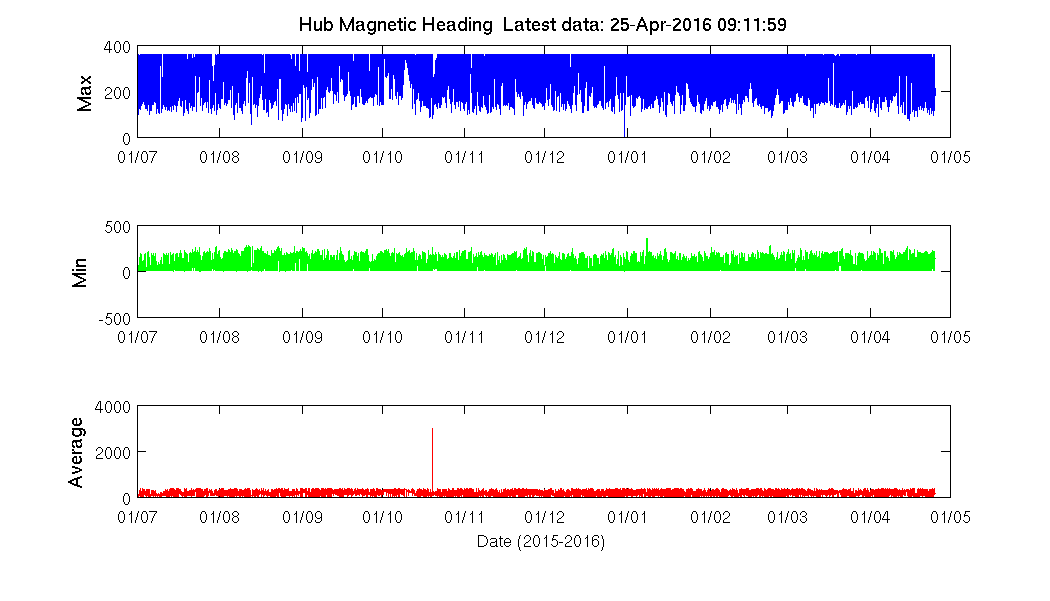
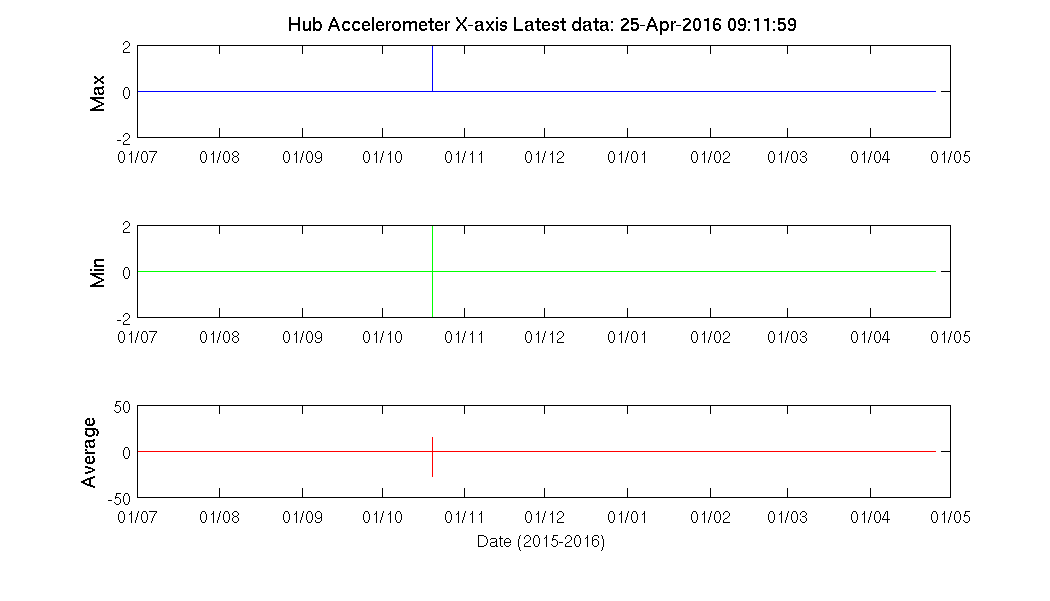
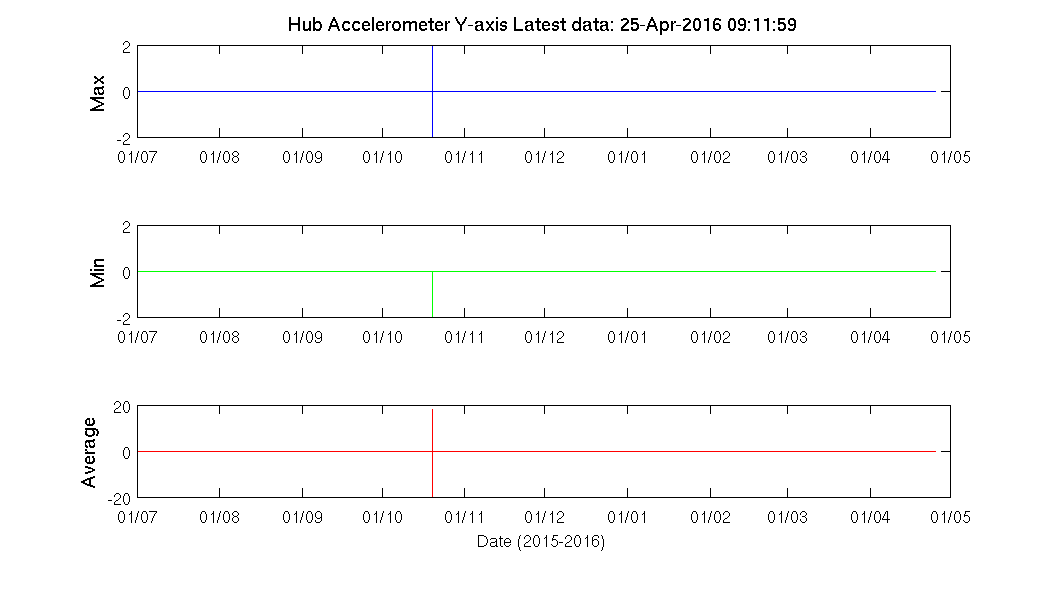
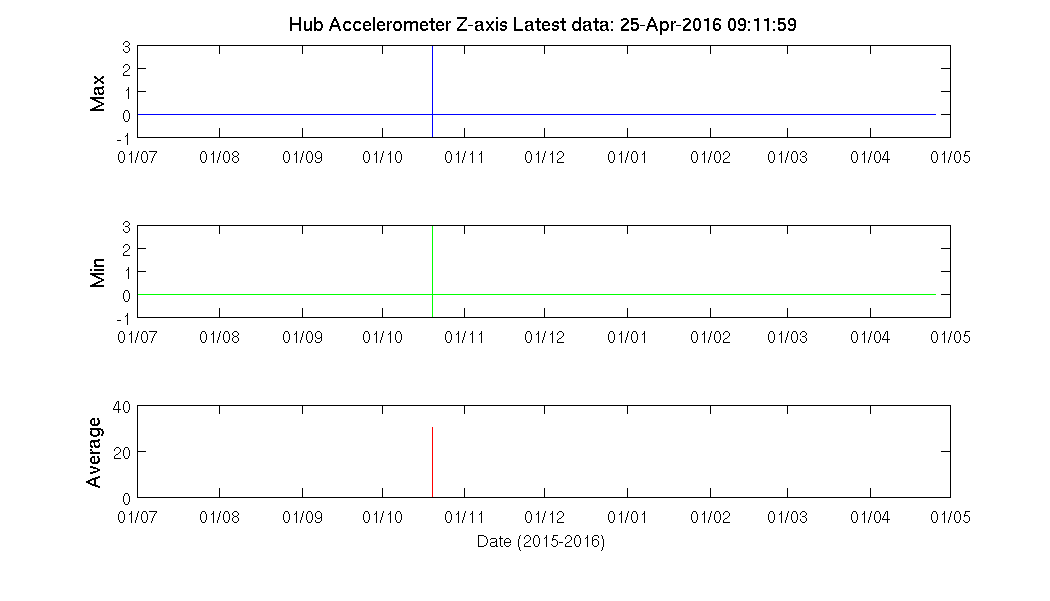
Hub Monitors
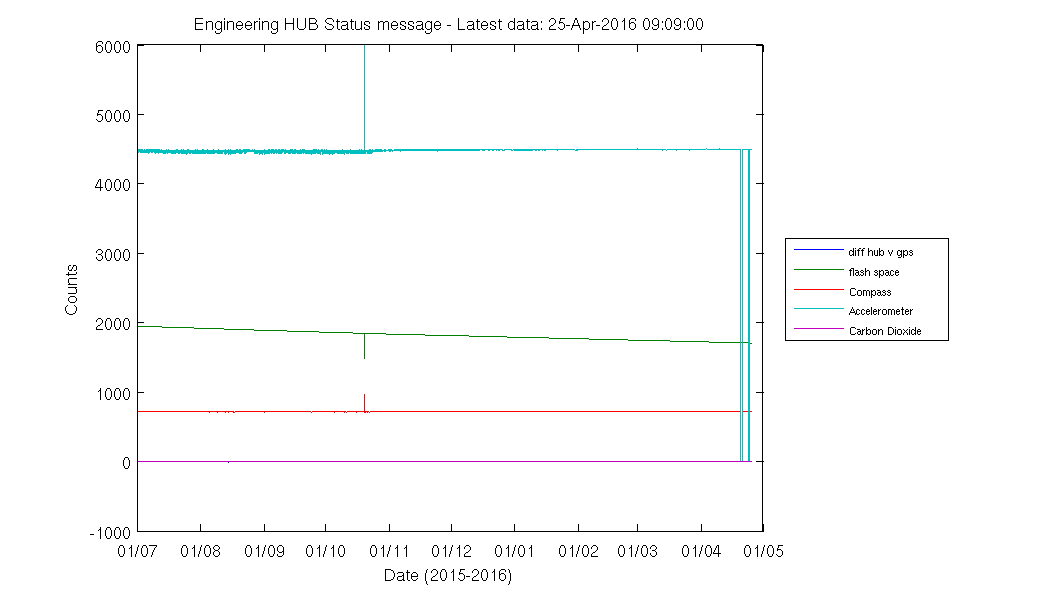
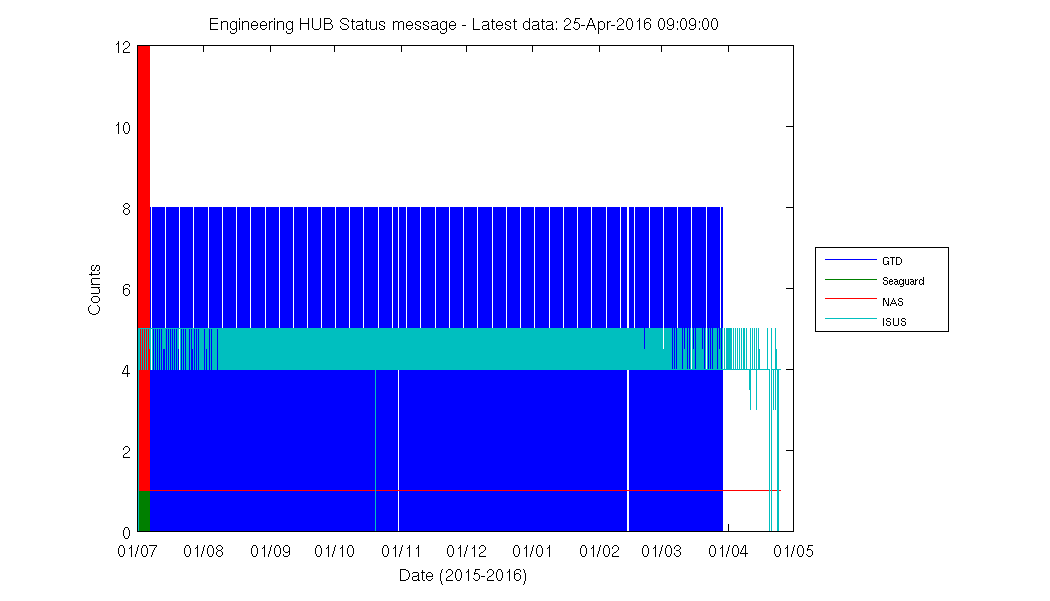
Hub Monitors